Elastic Stack: SIEM Deployment & Intrusion Detection
Constructed an enterprise Elastic Stack 9.5.5 SIEM environment from scratch via manual ISO installation on Ubuntu Server 24.04 LTS in VirtualBox. Enrolled centralized Elastic Agents across Ubuntu Linux and Windows 10 endpoints via dedicated Fleet Server policies. Simulated multi-vector credential attacks from Kali Linux, including parallel Hydra SSH brute force and RDP password spraying after triaging CredSSP and NLA incompatibilities with legacy tools. Discovered critical schema nuances during manual KQL investigation, uncovering that parsed ECS outcome fields were misleading compared to raw message telemetry. Engineered and validated two distinct automated Detection Rules (Custom Query vs Threshold Aggregation) mapped to MITRE ATT&CK T1110.001 (Password Guessing), resolved 8 real-world infrastructure incidents, and generated persistent dual-endpoint SOC monitoring dashboards.
Validated 39 automated Linux alerts and 26 aggregated Windows threshold events against real-world SSH and RDP brute-force simulations, mapped detection rules to MITRE ATT&CK T1110.001, resolved 8 infrastructure incidents including a critical Fleet NAT routing misconfiguration, and delivered two persistent monitoring dashboards.
Key Metrics & Measurable Impact
Empirical detection metrics validated across multi-OS brute-force attacks, KQL threat hunting, and MITRE-mapped alert rules.
Ubuntu Linux and Windows 10 endpoints plus self-monitoring Fleet Server
Custom Query (Linux) and Threshold Aggregation (Windows) mapped to MITRE T1110.001
39 automated real-time alerts on Linux, 26 aggregated threshold events on Windows
Historical attack telemetry correlated during initial query validation
Organized across 4 evidence directories and 6 structured writeup files
33 milestones completed, 4 non-blocking items planned for publication
Work Artifacts & Key Evidence
Selected technical screenshots and logs. Use the side arrows to scroll or click any card to inspect.
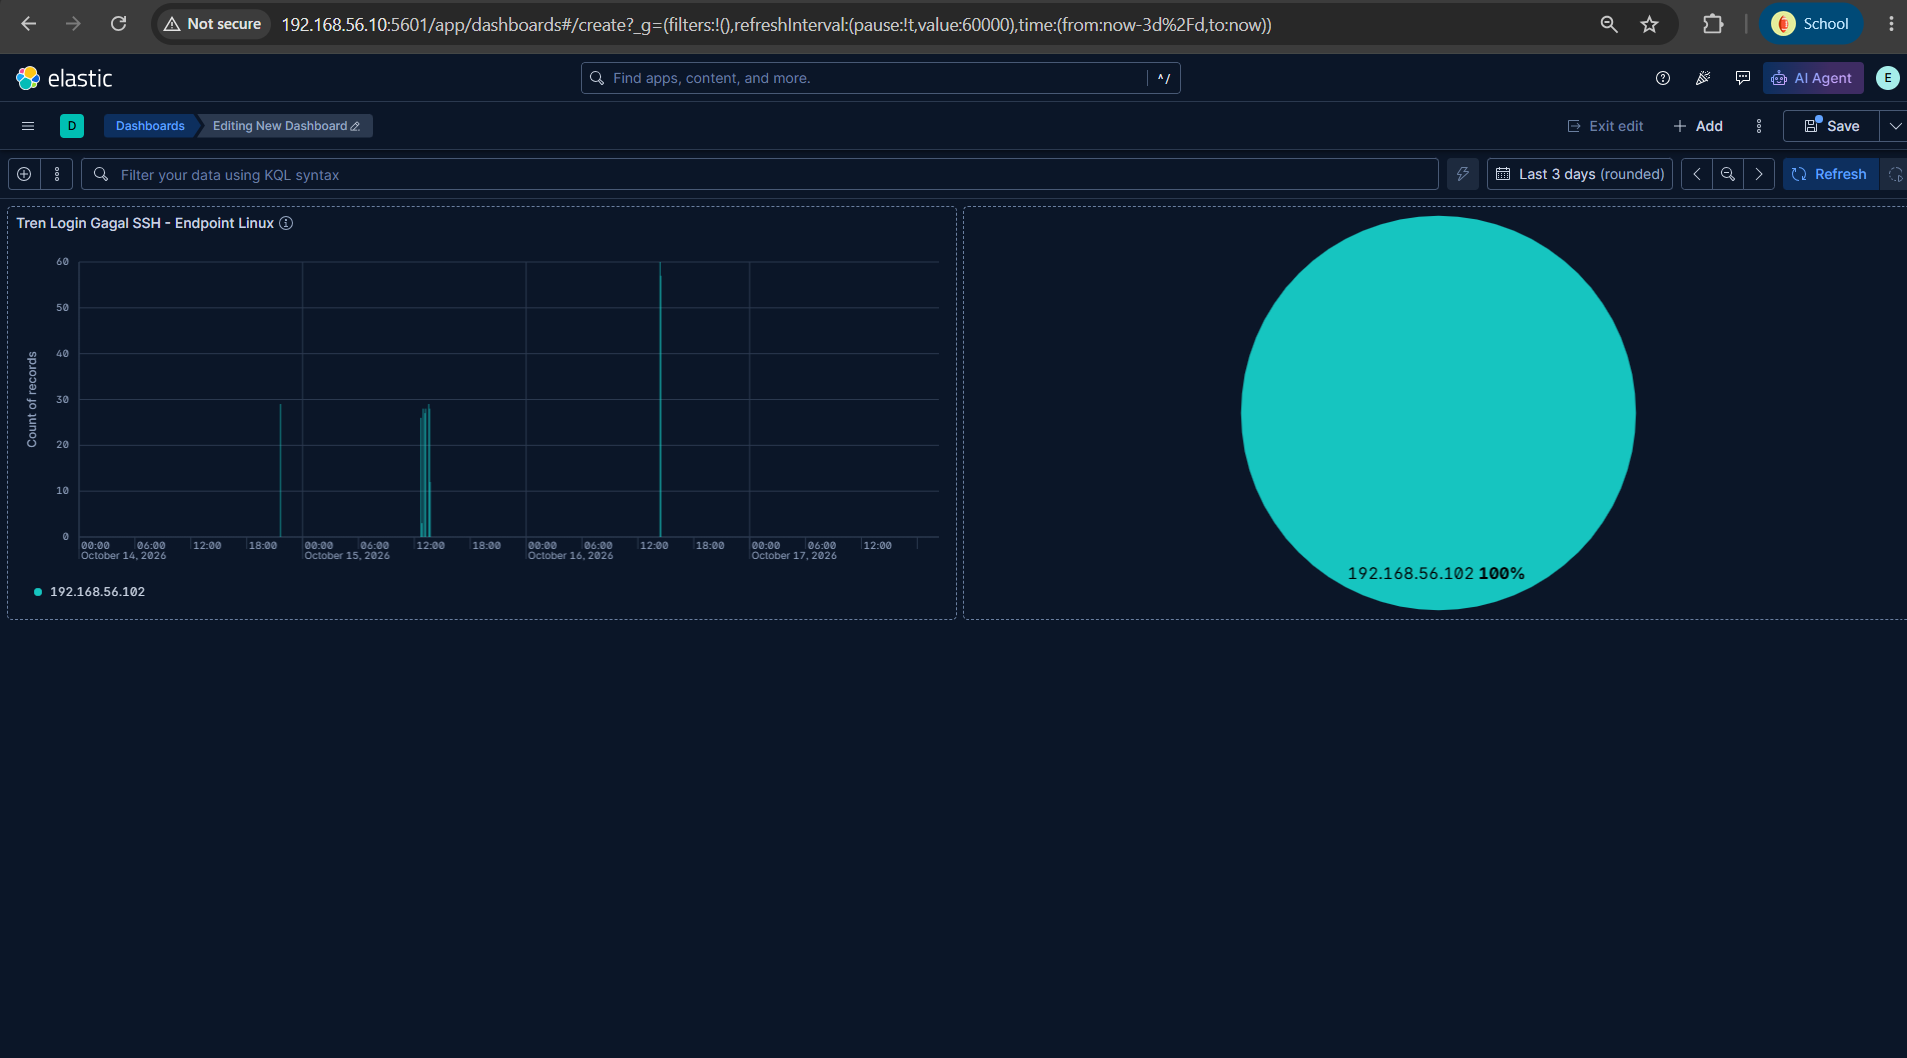
Linux SSH Brute Force Monitoring Dashboard
Consolidated dual-panel SOC dashboard correlating SSH brute-force event velocity over time with top malicious source IP addresses.
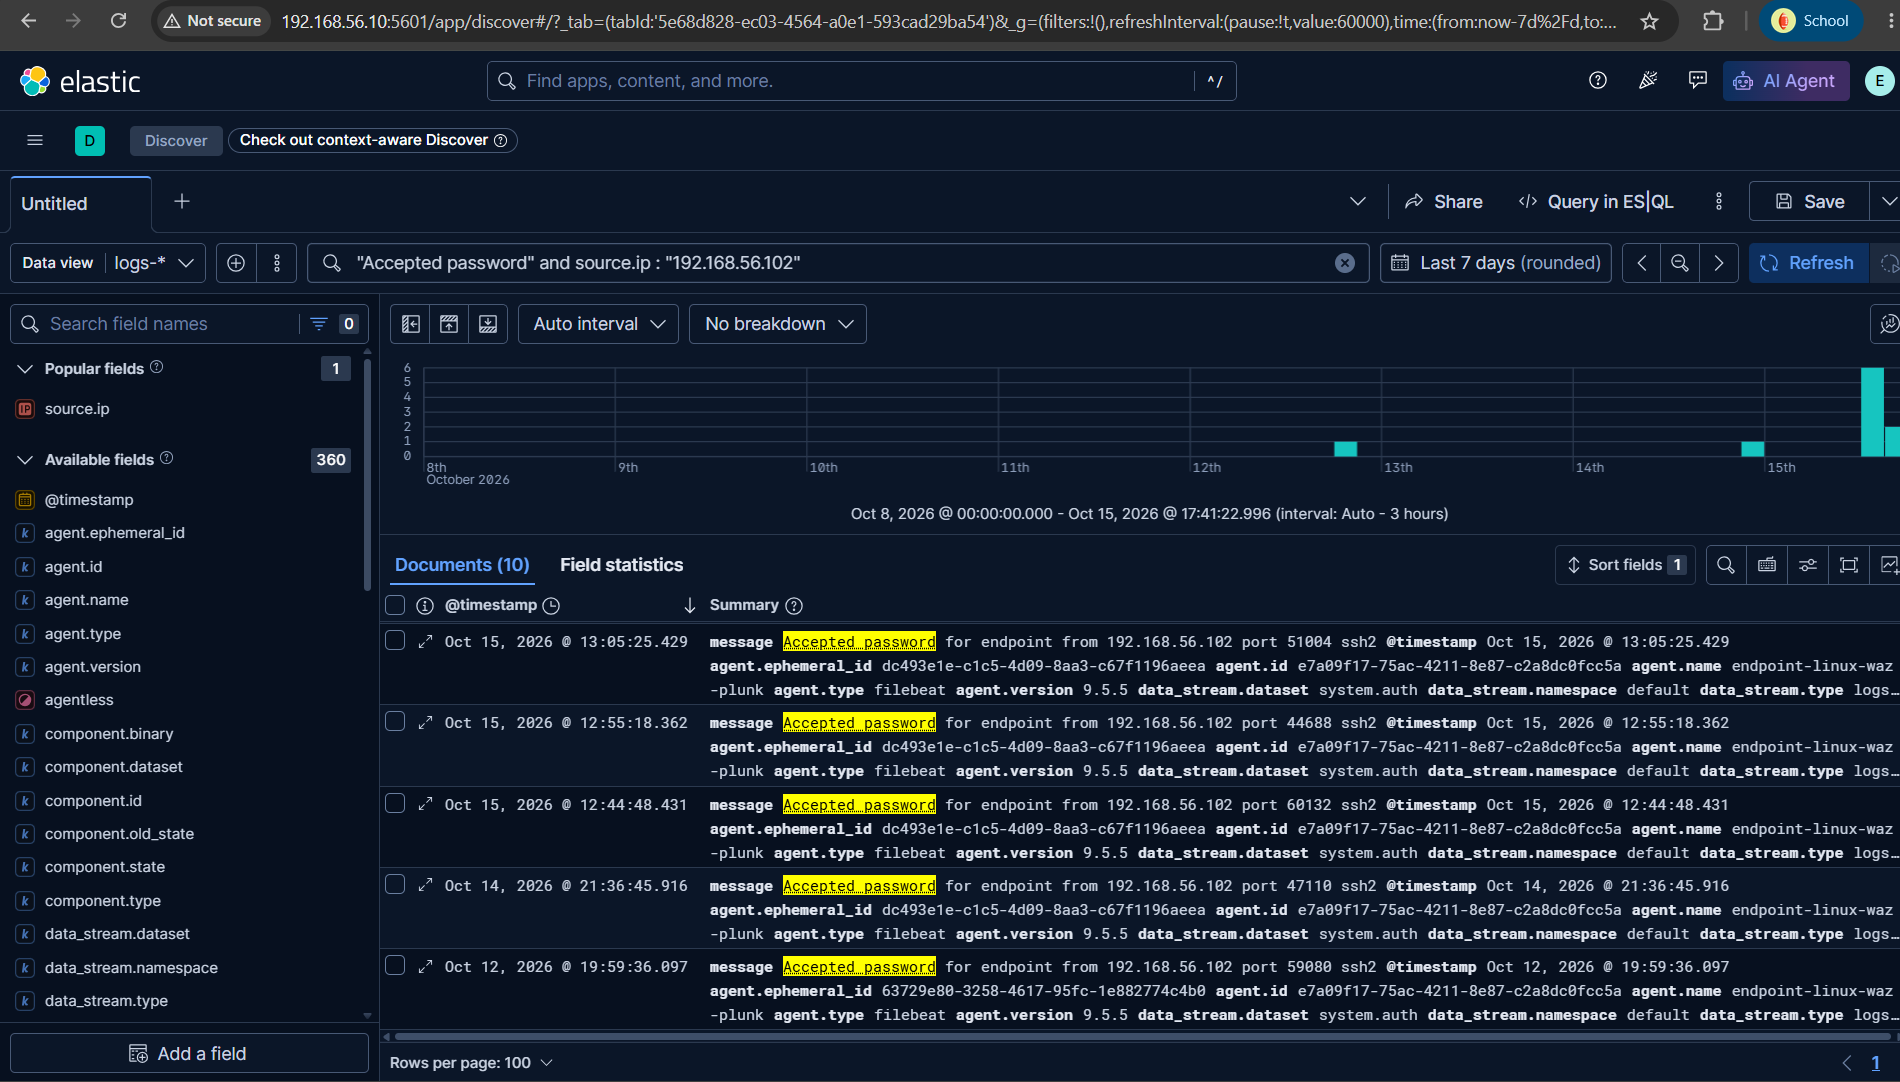
Root Cause Log Discovery (Raw Message Field)
Key threat hunting breakthrough: identified raw message field as the single source of truth after parsed ECS fields yielded false negatives.
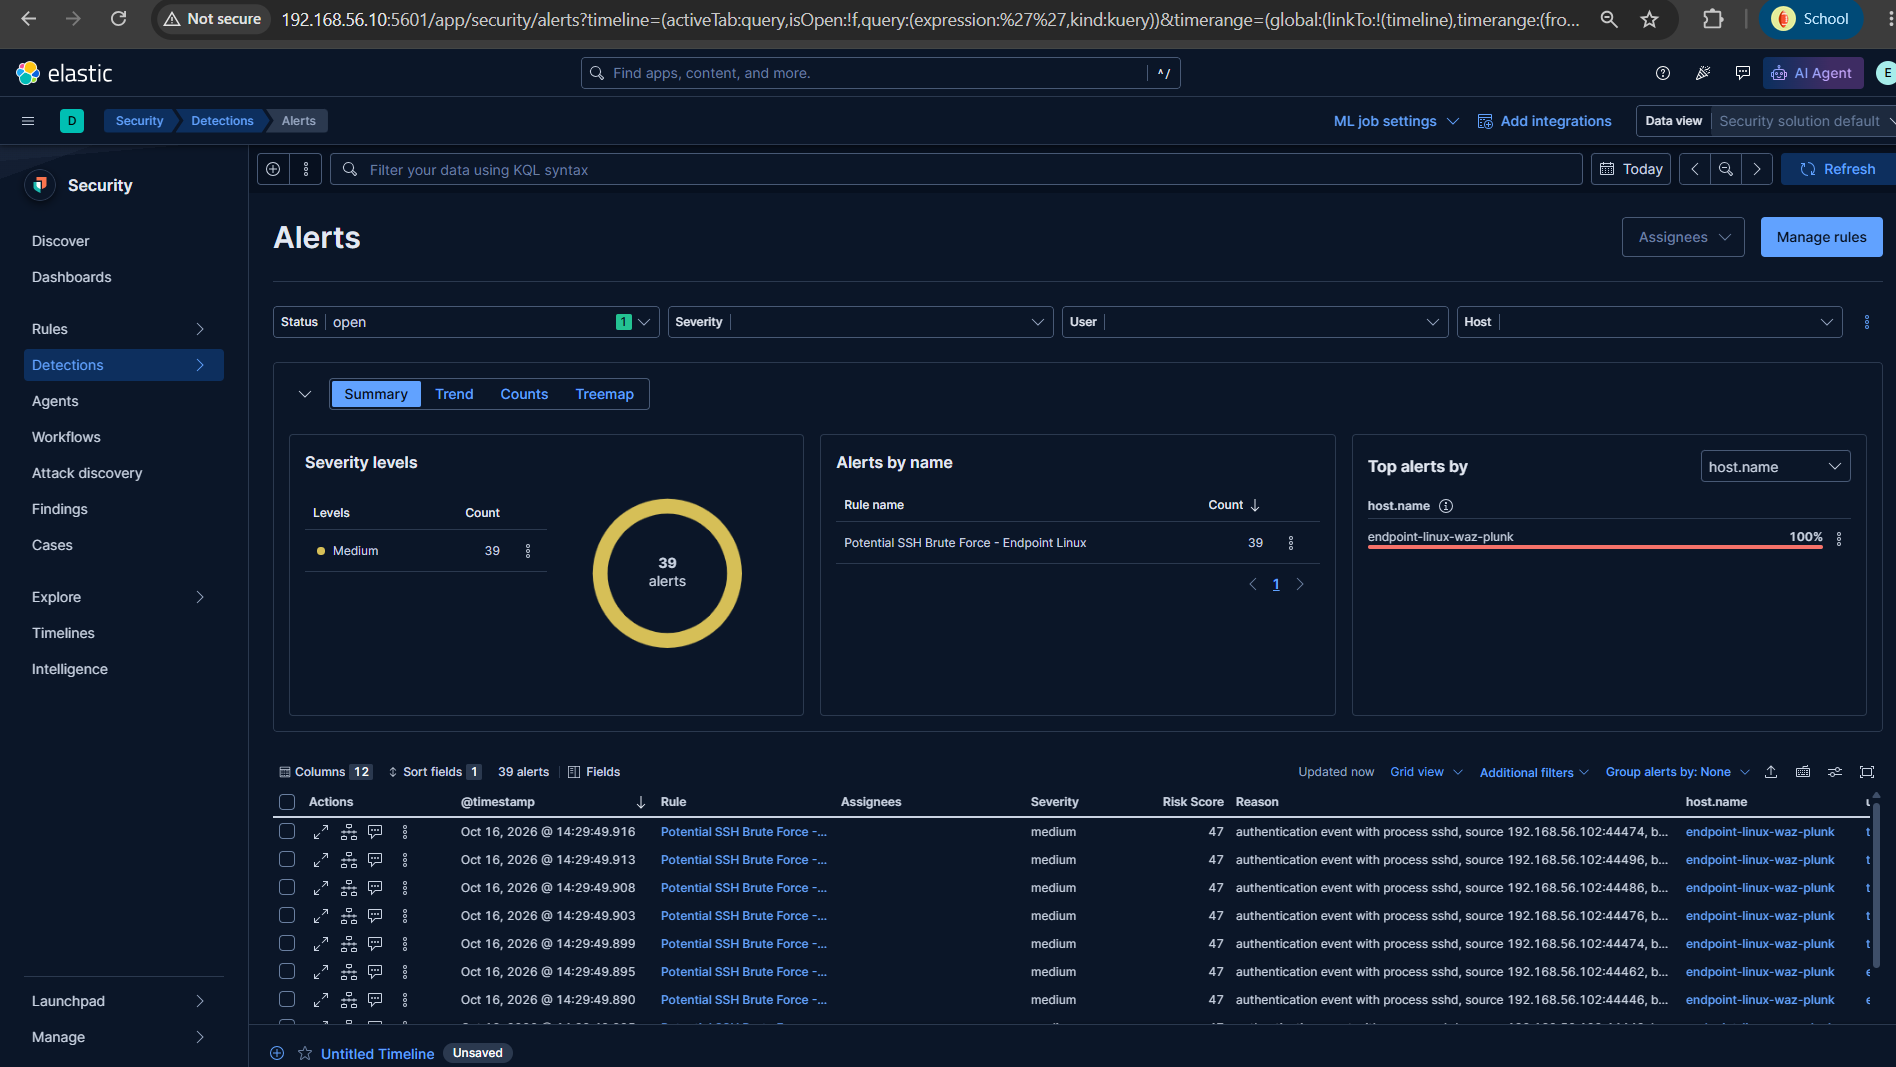
Automated Detection Rule Validation (39 Alerts)
Automated Detection Engine verification: 39 high-fidelity alerts triggered without manual intervention upon repeated adversarial simulation.
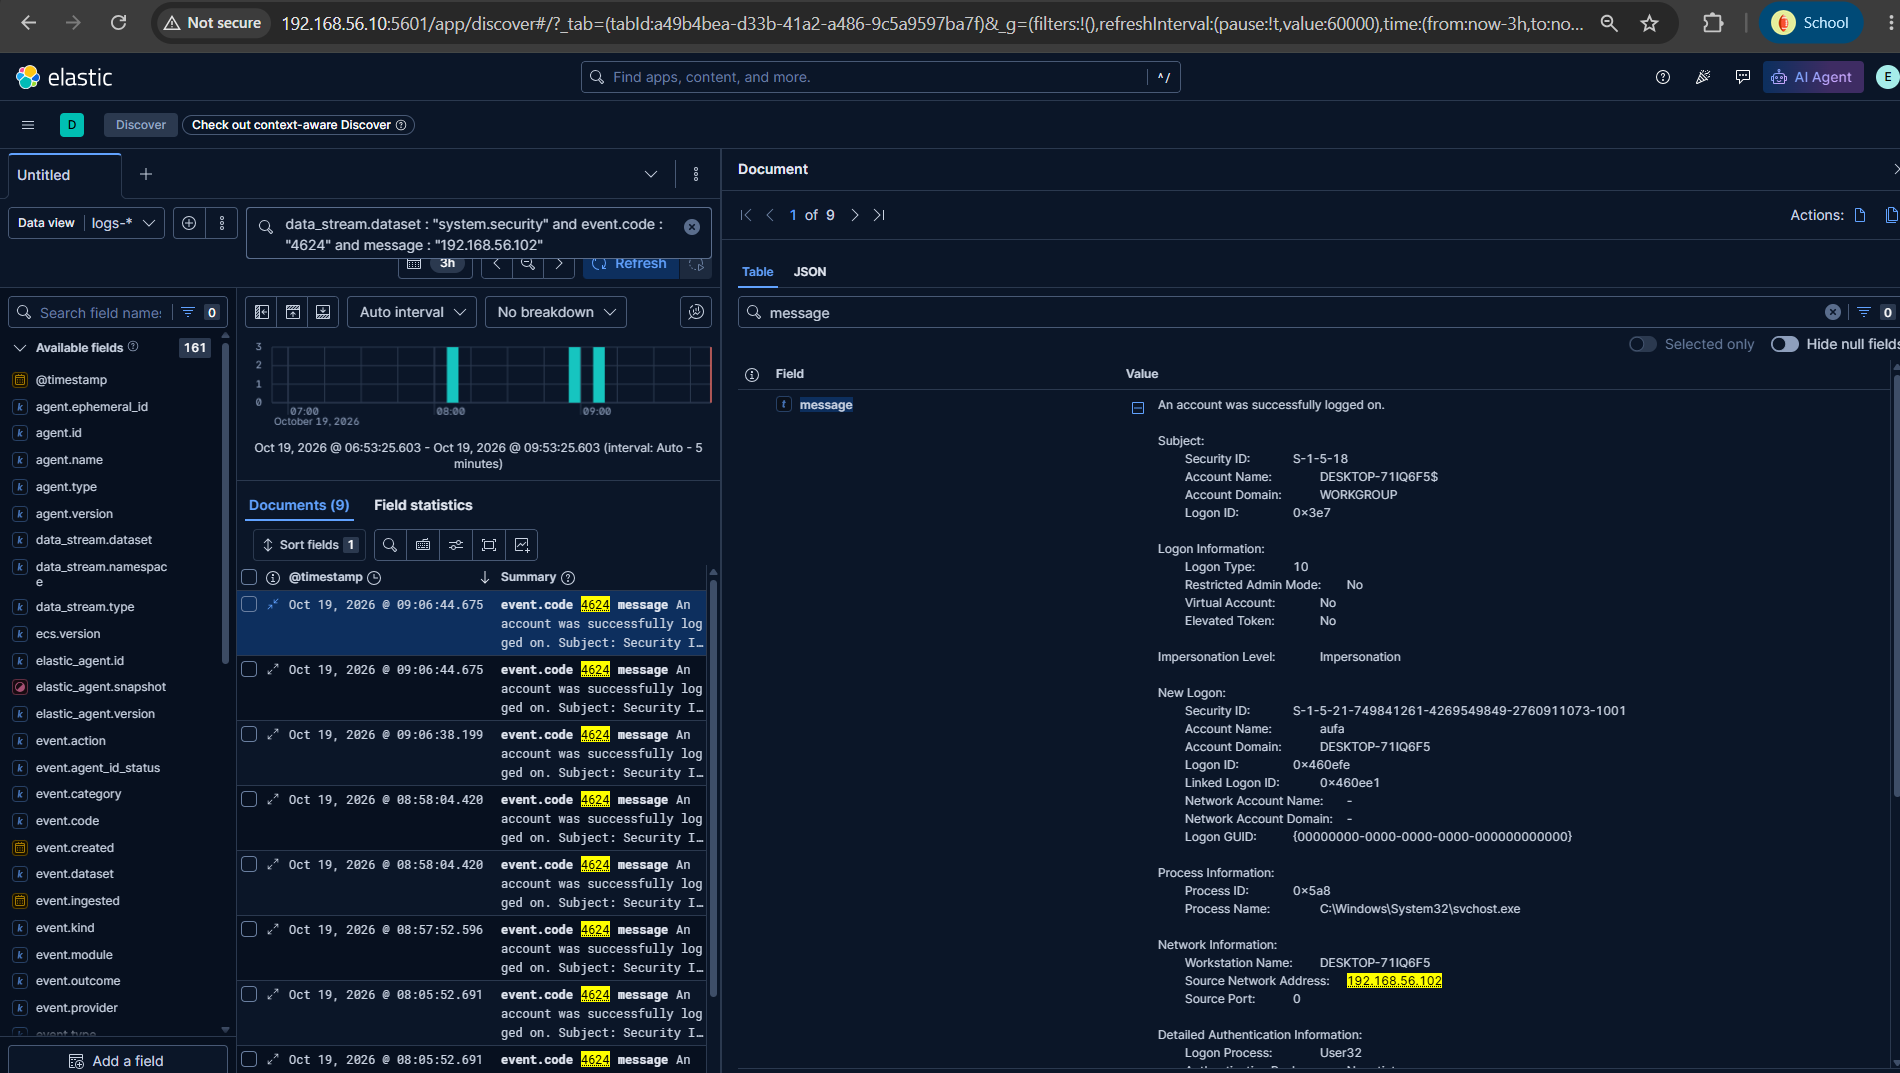
Windows Forensics: Event ID 4624 LogonType 10
Windows Security Event Log forensic triage: verified remote desktop compromise through Event ID 4624 with LogonType 10.
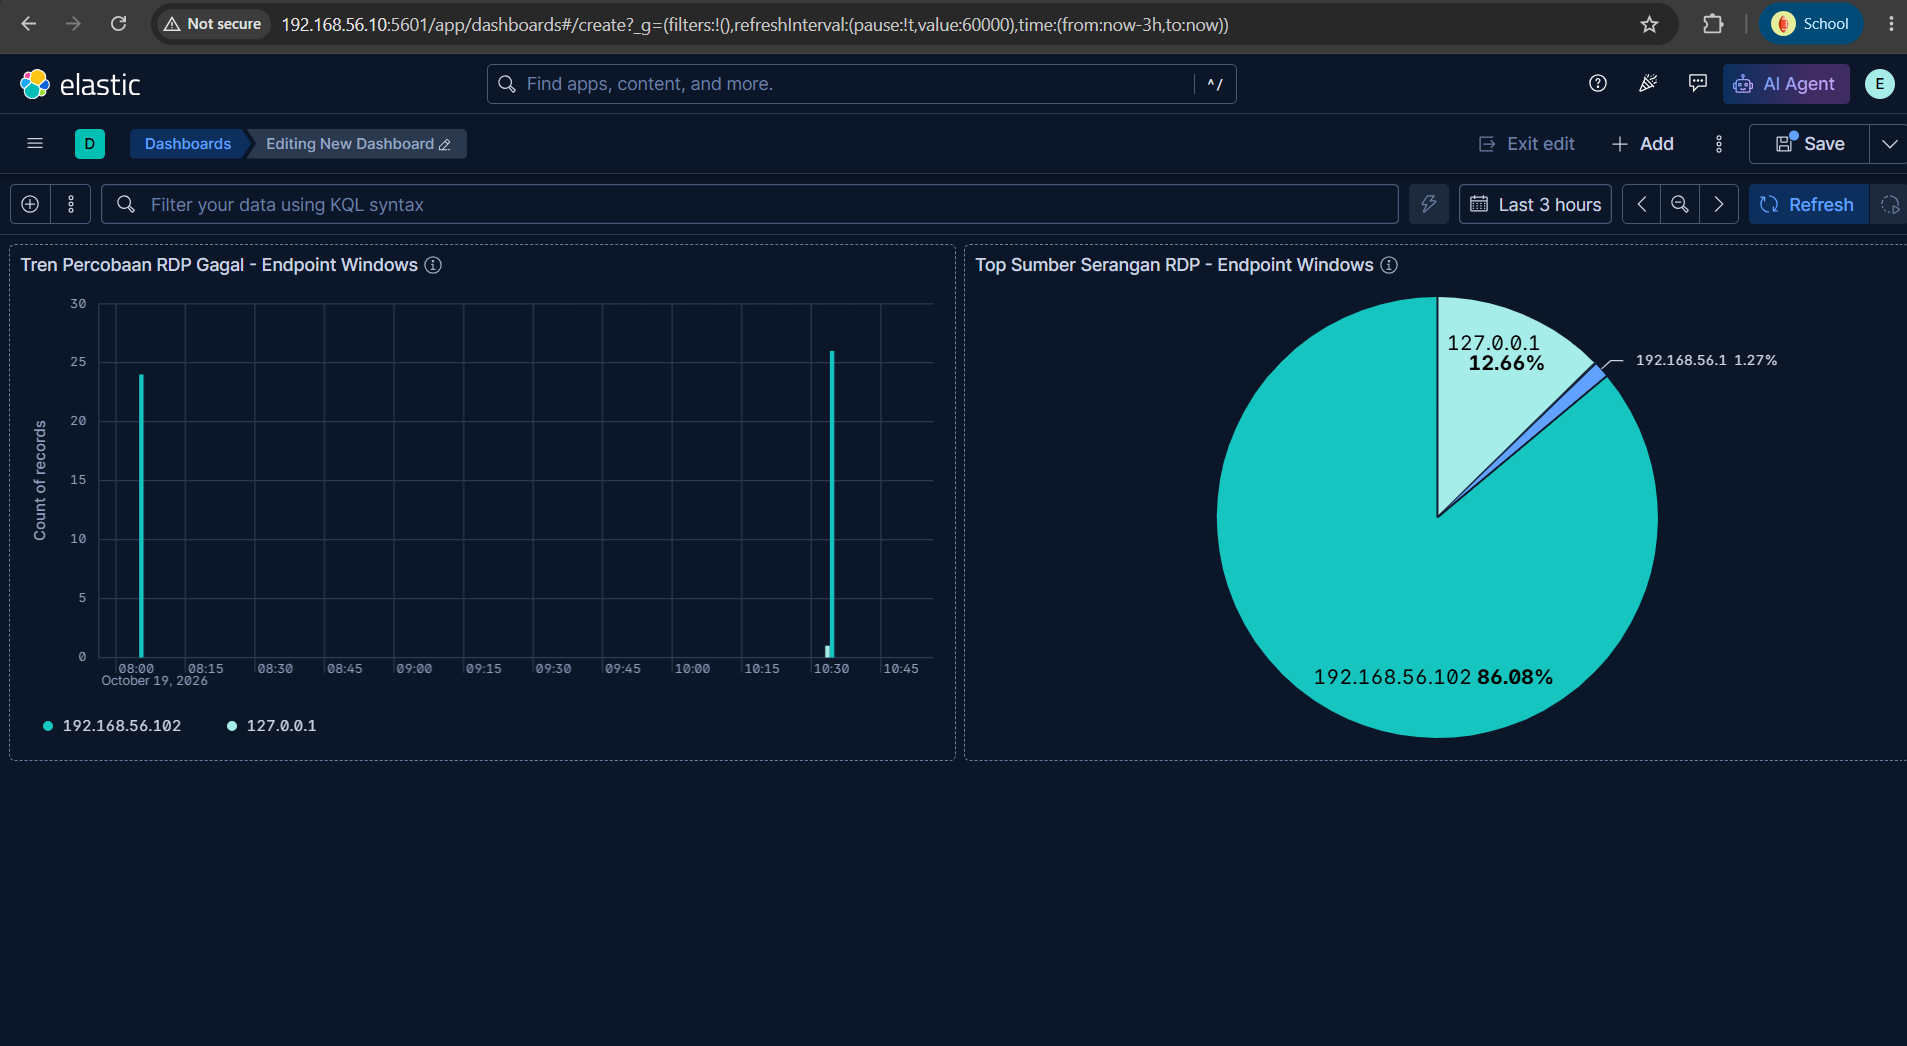
Windows RDP Threat Monitoring Dashboard
Two-panel Kibana dashboard tracking Windows RDP brute-force velocity and credential stuffing indicators, completing dual-endpoint SOC visibility.
Investigation Timeline
Manual Stack Deployment & Fleet NAT Triage
Installed Elasticsearch, Kibana, and Fleet Server 9.5.5 on Ubuntu Server 24.04 LTS (192.168.56.10). Resolved critical Fleet routing bug where agents attempted communication over internal NAT (10.0.2.15); corrected Kibana Fleet output to Host-only IP and restored healthy enrollment.
Dual-OS Agent Onboarding & Dormancy Troubleshooting
Enrolled Elastic Agents on Ubuntu Linux and Windows 10. Triaged Windows agent offline state following VM sleep, discovering that despite Automatic StartType the service required manual restart; codified prevention in a daily 7-step startup SOP.
Adversarial Simulation & KQL Schema Ground Truth
Simulated SSH brute force via Hydra against Linux endpoint. During Kibana Discover triage, identified that parsed event.action fields were misleading, whereas raw message logs reliably captured PAM authentication failures.
Detection Rule Engineering & MITRE ATT&CK Mapping
Engineered two complementary detection rules mapped to MITRE T1110.001: a Custom Query rule on Linux generating 39 automated alerts, and an aggregated Threshold rule on Windows capturing 26 failed RDP attempts (Event ID 4625, LogonType 10).
Implementation Phases & Checklist
- ✓Create dedicated elastic-server VM (8 GB RAM, 4 vCPUs, 50 GB disk)
↳ Isolated Ubuntu Server 24.04 ISO installation
- ✓Configure dual-adapter network (Host-only 192.168.56.0/24 + NAT 10.0.2.0/24)
- ✓Assign static IP 192.168.56.10 on enp0s8 interface
- ✓Install and verify Elasticsearch 9.5.5 with TLS and native security
- ✓Install and bind Kibana 9.5.5 to Host-only interface for browser access
- ✓Deploy Fleet Server and verify Healthy status after encryption key setup
- ✓Establish segregated Elastic Agent policies for Linux and Windows
- ✓Enroll Linux Elastic Agent into dedicated Linux policy
- ✓Troubleshoot and resolve Fleet output misdirecting traffic to internal NAT IP
↳ Major triage milestone: reconfigured output to Host-only adapter
- ✓Enroll Windows Elastic Agent into dedicated Windows policy
- ✓Triage Windows Agent offline state following VM dormancy
↳ Identified service startup behavior and established manual elevation runbook
- ✓Enable RDP on Windows endpoint across Registry, Firewall, and Service layers
- ✓Formulate daily lab startup SOP to prevent stale status diagnosis
↳ Added step 7 specifically for Windows agent verification
- ✓Execute initial Nmap port reconnaissance against Linux endpoint (Port 22 open)
- ✓Simulate SSH brute-force attack using Hydra and custom wordlist
- ✓Conduct KQL investigation discovering raw message field as reliable truth source
↳ Demonstrated parsed event.action and outcome fields were misleading
- ✓Author and enable Custom Query Detection Rule (Medium severity, risk score 47)
- ✓Verify automated rule execution (39 real-time alerts, 181 historical preview alerts)
- ✓Build and save persistent 2-panel Linux SSH threat dashboard
- ✓Conduct Nmap reconnaissance confirming open RDP port 3389
- ✓Triage CredSSP and NLA limitations with Crowbar, pivot successfully to Hydra
- ✓Investigate Windows Security Event IDs 4625 (failure) and 4624 (success)
↳ Validated LogonType 10 (RemoteInteractive) and reliable source.ip telemetry
- ✓Validate successful RDP credentials independently via xfreerdp session
- ✓Engineer Threshold Detection Rule mapped to MITRE ATT&CK T1110.001
↳ Contrasting threshold aggregation against Linux custom query approach
- ✓Verify automated rule execution (26 threshold events aggregated into single alert)
- ✓Build and save persistent 2-panel Windows RDP threat dashboard
- ✓Structure repository directories (writeup, evidence, configs, learning-notes)
- ✓Draft comprehensive SOP and troubleshooting documentation covering 8 incidents
- ✓Compile KQL cheatsheet with validated Linux and Windows hunting queries
- ✓Formulate multi-stage context handoff documentation
- ✓Author complete 5-phase investigation writeups with inter-document navigation
- ✓Generate redacted configuration backups for Elasticsearch and Kibana
- ✓Generate repository README index and project snapshot document
- ○Populate learning-notes directory with general architectural concepts
- ○Push completed elastic-homelab repository to GitHub
- ○Evaluate optional upgrade of Linux Detection Rule to Threshold aggregation
- ○Investigate automated notification channels (Slack or webhook integration)
Documentation & Technical Reports
This project was developed strictly for cybersecurity education, threat detection engineering, and professional portfolio demonstration. All adversarial simulations (SSH and RDP brute force) were executed within an isolated, self-hosted virtual lab environment (VirtualBox Host-only network) targeting owned virtual machines exclusively.